

Image source: https://docs.aws.amazon.com/images/parallelcluster/latest/ug/images/CW-dashboard.png
The things I’m most interested in seeing, however, are sort of hidden away as composite metrics that are graphed:

Each one of those graphed composite items is something that I, as an HPC support person or cluster operator, would like to know about, ideally as soon as possible. I am very interested in:
- Instance Provisioning Errors
- Unhealthy Instance Errors
- Custom Action Errors
My ParallelCluster Monitoring/Alerting Goal
- Learn about ParallelCluster issues before end-users report them
- Real-time or near real-time alerts for the following HPC cluster or compute fleet conditions
- Cluster enters PROTECTED MODE state for any reason
- Compute fleet enters STOPPED state for any reason
- Bootstrap failures when using s3:// scripts configured as part of an OnNodeBoot CustomAction
- Node creation issues originating from the AWS EC2 service due to
- Insufficient Capacity errors
- vCPU quota limit breached
Turning Monitoring/Alerting Goals into Terraform
Step 1 – SNS Topic
The first set of resources we need to create is the standard design pattern for receiving messages/alerts and allowing different consumers to subscribe to those messages — an AWS SNS Topic. We have two different subscribers to the SNS Topic we created:
- Standard email subscribers who will get email each time a message is delivered to the Topic
- A simple Python Lambda function is also subscribed to the SNS Topic. The purpose of this lambda function is to receive the message, format it for better readability and deliver it to a Slack Channel via a webhook HTTPS address

Step 2 – Cloudwatch Metric/Alarm Pairs and a Cloudwatch Subscription Filter
I had to break my monitoring setup into two different styles of monitored conditions:
- Simple conditions where basic “ALARM” or “OK” status was sufficient, with no additional contextual details needed.
- More complex conditions where I wanted to send detailed information extracted from JSON-formatted log entries into the Alert Message
For the simple conditions the well established Cloudwatch Metric / Cloudwatch Alarm pairing is sufficient. We create a new Metric, set the default value to 0 and then scan the log group for patterns we care about. When the pattern is found we use the Sum function to add 1 to the value of the metric. For the paired Alarm it is even more simple — the alarm is in OK status when the paired metric value is 0 and in ALARM status when the paired metric value is >= 1.
Whenever the Alarm is triggered we notify the SNS Topic and whenever the Alarm clears back to OK status we also notify the SNS Topic.
This simple “Alarm” and “OK” status works great for two core conditions I want alerts on:
- Cluster in PROTECTED mode
- Compute fleet in STOPPED state
However, there are more complex things I want to monitor and most importantly I want to extract data from the log entries and send that information into the SNS Topic for delivery to my Slack channel or email inbox. We can’t use Cloudwatch Metric Filters for that.
To handle the more complex scenario, we use CloudWatch Subscription Filters, which enable real-time monitoring and (even better) forward the contents of log messages to various AWS services for downstream handling and processing. This involves:
- Creating a Subscription Filter that looks for JSON-formatted log messages
- When detected, the Subscription Filter sends the log payload to a lambda function that parses the JSON log entry, makes a more “human readable” summary, and then forwards that on to the SNS Topic for delivery to the email inbox or Slack channel.
This is what it looks like as a simple architecture diagram:

The image gallery below shows what the detection of “PROTECTED MODE” status looks like in both the AWS Cloudwatch console and the Terraform code that creates the Metric Filter and Alarm.
It’s very simple and cheesy — you will note that we are filtering for a simple pattern:
%WARNING - Cluster is in protected mode%
What an Alarm announcement looks like in slack
It’s just a simple “ALARM” or “OK” status with some extra information about the environment and alarm description added in by the lambda that takes messages from the SNS Topic and sends to the Slack webhook URL:

Handling the more complex error conditions
For anything related to node bootstrap errors, vCPU quota errors or errors thrown by AWS for insufficientCapacity we need to be a bit more sophisticated in how we handle things. This is because we (ideally) want to extract contextual information from the log entry itself and send that along into the SNS Topic.
This is where CloudWatch Subscription Filters come in — their primary purpose is to forward log data to various AWS services for downstream processing.
The good news is that, when looking at ParallelCluster error logs, I noticed that for almost everything I care about, ParallelCluster generates a beautiful, fully loaded JSON error message with great detail.
Here is an example error message from a compute node bootstrap failure when the IAM Instance Role on the node did not have permission to download the bootstrap script from the S3 bucket:

That is a FANTASTIC error log entry! It tells us exactly where the error happened (during a CustomAction OnNodeStart event) and what happened (a permission denied on an S3 download attempt …). Getting this level of detail into our Alert message is essential, as it saves tons of time by eliminating the need to scan log files for “what went wrong …“.
This is also really straightforward to set up. We create a Cloudwatch Log Group Subscription Filter that also looks for a simple pattern matching the JSON payload that ParallelCluster commonly logs.
And whenever we hit that pattern we send the payload to a python lambda function that reformats the JSON log entry into a prettier more human-readable message that then gets delivered to the SNS Topic responsible for delivering messages to email inboxes and the Slack webhook URL
Subscription Filter Design Attempt 1 (ERROR messages only)
{ $.level = \"ERROR\" }{ $.level = * }

{ $.level = * }# ignore logs where event-type = "compute-node-idle-time"
if event_type=='compute-node-idle-time':
print(f"Skipping event-type: compute-node-idle-time")
continue

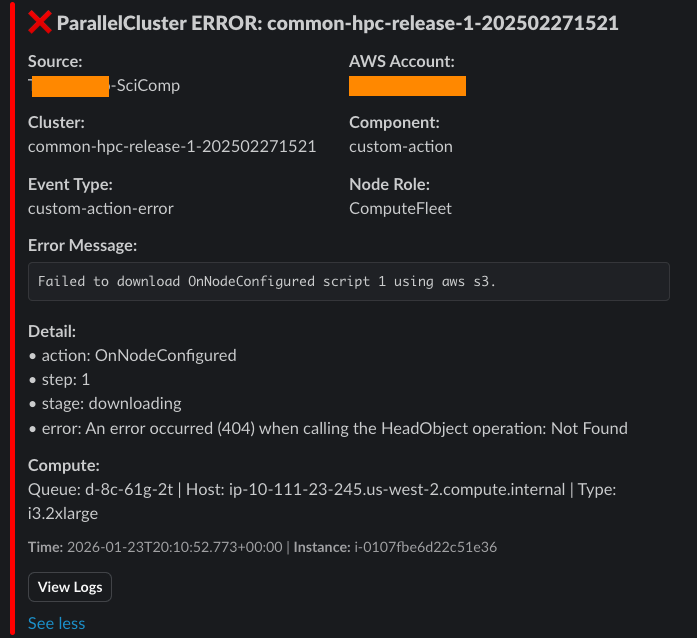
What the “complex” Alert message looks like in slack
The value here is that we go beyond simple “ALARM” and “OK” status. By using a Cloudwatch Subscription Filter and a lambda to process the log and turn it into a formatted message we get much more useful and actionable alerts.
The alert below clearly shows that a compute node failed to start because the configured path to the S3:// hosted bootstrap script had a typo in it, resulting in a “404 not found” error when the download was attempted.


